After years of rising prices—cresting to a 40-year high last year—inflation in the U.S. stabilized at 3.7% in September. (The Federal Reserve’s goal is to reach 2%.) Some areas of the country are feeling the pinch more than others. The personal finance site WalletHub recently analyzed 23 major metropolitan statistical areas according to the Consumer Price Index, which measures inflation. They looked at the change in prices in each area, compared to two months ago and one year ago. According to that data, these are the ten American cities that are being hit hardest by inflation.

2-month Consumer Price Index increase: 1.5%
1-year Consumer Price Index increase: 2.2%
“The July-September increase was attributed to a rise in the all items less food and energy index,” the U.S. Bureau of Labor Statistics noted in a news release this week. “Within this category, prices were higher over the two-month period for shelter, apparel, and public transportation. However, prices were lower for used cars and trucks and household furnishings and operations.”
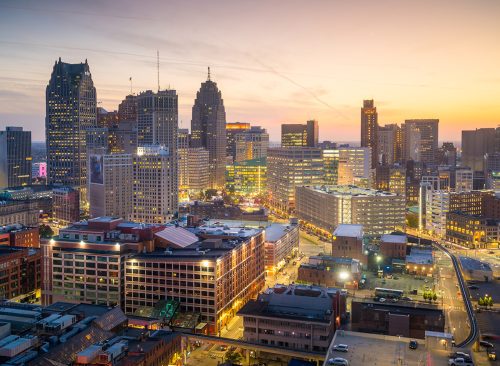
2-month increase: 0.6%
1-year increase: 5.9%
According to the BLS, the area’s consumer price index for all items except food and energy rose 7% over the year. Food prices increased 3% percent, while energy prices declined 4.8 percent, “largely the result of a decrease in the price of gasoline.”

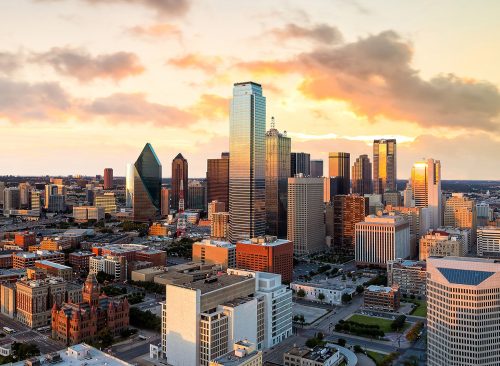
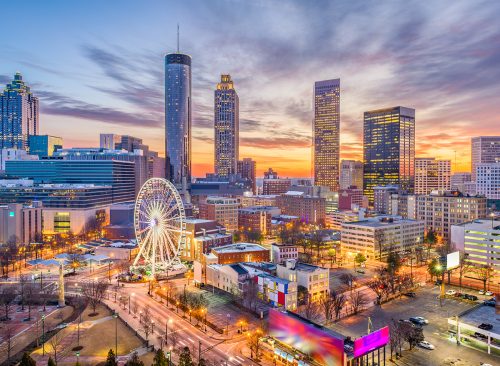
2-month increase: 1.3%
1-year increase: 3.3%
“The September increase was due in large part to rising prices for shelter, as well as education and communication,” the BLS said in a news release. It noted food prices were up 4.2% over the year, and energy prices declined 1.4%, largely because of lower natural gas prices.
2-month increase: 1%
1-year increase: 4.6%
“A 1.7% increase to prices paid for shelter was the largest contributor” to rising prices, the BLS said in a recent release. “The all items less food and energy index rose 1.0% in August and September, along with the energy and food indexes, which advanced 3.1% and 0.3%, respectively.”
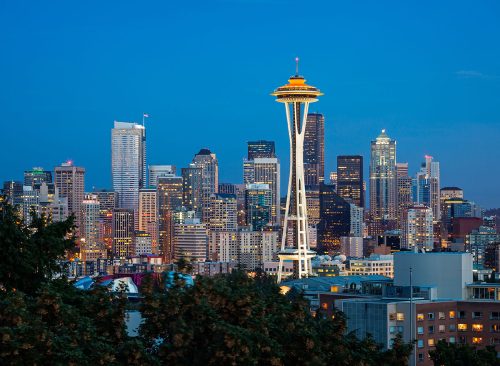
2-month increase: 0.8%
1-year increase: 5.4%
Over the last year in the Seattle area, food prices rose 4% and energy prices increased 6.3%, “largely the result of an increase in the price of natural gas service,” the BLS said in a news release.
2-month increase: 1.1%
1-year increase: 4.4%
“The food index and the energy index also increased over the past year, up 5.2% and 7.8% respectively,” the agency noted.
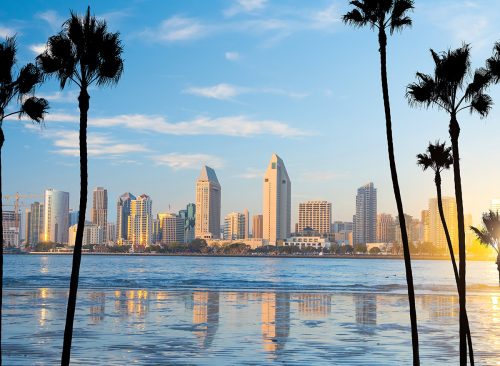
2-month increase: 1.3%
1-year increase: 4.7%
The area’s two-month increase was driven by higher prices for gas and housing, the BLS said. Over the last 12 months, “food prices increased 3%. Energy prices advanced 6.7%, largely the result of an increase in the price of electricity.”
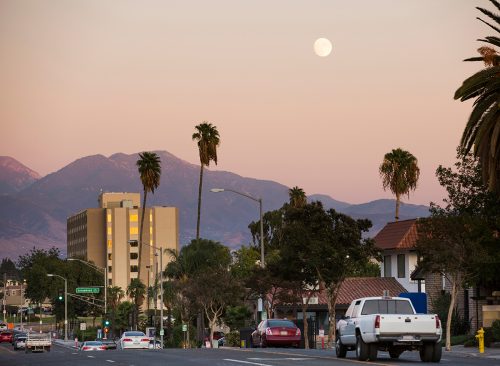
2-month increase: 1.4%
1-year increase: 4.9%
In the last year, the Riverside metro area’s “food prices increased 3.4 percent,” said the BLS. “Energy prices advanced 5.1 percent, largely the result of an increase in the price of electricity. The index for all items less food and energy increased 5.5 percent over the year.”
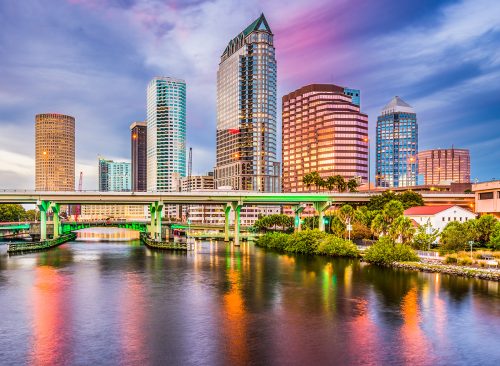
2-month increase: 1.1%
1-year increase: 6.7%
In the Tampa area, “The index for all items less food and energy advanced 7.3% over the past year,” the BLS said. “The food index continued to rise, up 4% over the last 12 months. The energy index also increased over the past year, up 5.9%.”
RELATED: Surprising Signs You’ve Already Had COVID
2-month increase: 1.2%
1-year increase: 7.8%
Florida has been hit by some of the nation’s highest inflation throughout 2023, with the Miami-Fort Lauderdale-West Palm Beach area coming in at #1 in this survey. In a release this month, the BLS noted that food prices in the area have risen 5.6% in a year and energy prices have increased 4.3%.